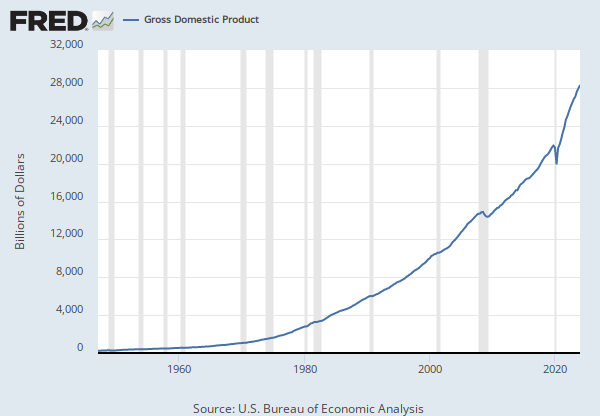
Observations
2023: 3,648,573,136.15155 | Current U.S. Dollars, Not Seasonally Adjusted | Annual
Updated: Dec 17, 2024 2:13 PM CST
Observations
2023:
3,648,573,136.15155
Updated:
Dec 17, 2024
2:13 PM CST
| 2023: | 3,648,573,136.15155 | |
| 2022: | 3,279,343,543.60416 | |
| 2021: | 2,929,446,578.25104 | |
| 2020: | 2,481,857,122.84010 | |
| 2019: | 3,395,798,882.68156 |
Units:
Current U.S. Dollars,
Not Seasonally Adjusted
Frequency:
Annual
Fullscreen


