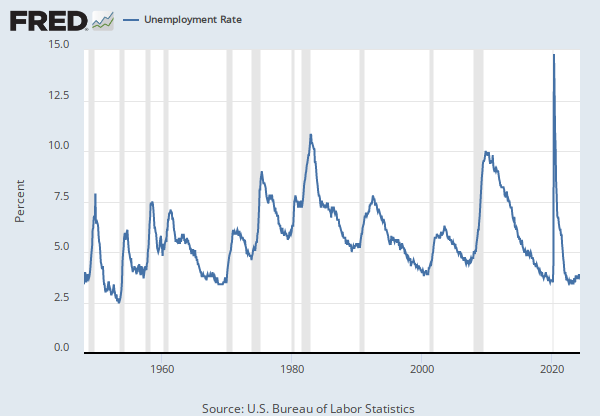
Series Is Presented Here As Three Variables--(1)--Original Data, 1929-1944 (2)--Original Data, 1940-1957 (3)--Original Data, 1947-1966. Unemployment Means The Difference Between The Number Of Persons In The Labor Force And The Number Of Persons Working. Negative Unemployment Arises Beginning June 1947, Figures Are Unrounded. Coal And Steel Strikes Ending In November 1949 Accounted For High Unemployment In October 1949. Also, A Large Number Of Coaal Miners And Steel Workers, Reported As Looking For Work In October, Were Later Classified As "With A Job But Not At Work," Which Led To The Decline In Unemployment In November (See Monthly Labor Review, Bls, December 1949). The Usual Decline In Unemployment From September To October Did Not Occur In 1949. Therefore The Use Of The Low Seasonal Index Distorted The Seasonally Adjusted Figures For October. The Sample Was Changed In January 1954 To 230-Area Sample. Figures For 1953 Were Revised Accordingly From September-December So The Series Is Continuous (For The Unrevised Figures See Current Population Report, P-50, No. 59, 1954 Anual, P. 53). The Sample Changed Again In May 1956 To A 330-Area Sample. Figures On The Old Sample Basis Are-- Original, 2.58; Adjusted, 2.77. Source: Bureau Of The Census, Monthly Report On The Labor Force, Data For 1940-1946: Report For 1940-1946, Series P-50, No. 2; Data For January-June 1947: Series P-57, No. 79, February 4, 1949; Data For July-December 1947: No. 84, July 8, 1949; For 1948-1952: No. 86, September 13, 1949, And Following Issues Through No. 139; For 1953-1957: No. 151, February 1955, And Following Issues.
This NBER data series m08084b appears on the NBER website in Chapter 8 at http://www.nber.org/databases/macrohistory/contents/chapter08.html.
NBER Indicator: m08084b
|
2005-08-01
|
2005-08-01
|


